
This post is also available in:
![]() Português
Português
Those days I was challenging myself to make an exact match and correlate all lines returned by a select on v$sga, v$sgainfo and v$sgastat.
The biggest problem on those v$ views is that they bring different visions of the same thing (SGA), and I could never make a exact match of the bytes before. Now it was time to solve this puzzle. So I've built 5 different scenarios playing with AMM (Automatic Memory Management), ASMM (Automatic Shared Memory Management), complete separated pools, in-memory and PDBs.
Let's check the results and conclusions. Please share in the comments any finding or anything valuable that you may want to add.
So for this task, I've created a CDB database with default DBCA parameters and than for each scenario I've slightly changed some parameters.
The environment configuration is as follows:
Database: 12.1.0.2 + DBBP 170718
Parameter File:
*.audit_file_dest='/u01/app/oracle/admin/orcl/adump'
*.audit_trail='db'
*.compatible='12.1.0.2.0'
*.control_files='/u01/app/oracle/oradata/orcl/control01.ctl','/u01/app/oracle/fast_recovery_area/orcl/control02.ctl'
*.db_block_size=8192
*.db_domain=''
*.db_name='orcl'
*.db_recovery_file_dest='/u01/app/oracle/fast_recovery_area'
*.db_recovery_file_dest_size=4560m
*.diagnostic_dest='/u01/app/oracle'
*.dispatchers='(PROTOCOL=TCP) (SERVICE=orclXDB)'
*.enable_pluggable_database=true
*.memory_target=800m
*.open_cursors=300
*.processes=300
*.remote_login_passwordfile='EXCLUSIVE'
*.undo_tablespace='UNDOTBS1'
All Memory Parameters inferred by Oracle based based on this pfile are:
SQL> col name for a35
SQL> col value for a35
SQL> set tab off pages 1000 lines 1000

SQL> select name, type, value from v$parameter where name like '%size%' or name in ('memory_max_target','memory_target','pga_aggregate_target','sga_target') order by 1;

NAME                                                TYPE VALUE
----------------------------------- -------------------- -----------------------------------
bitmap_merge_area_size                                 3 1048576
client_result_cache_size                               6 0
create_bitmap_area_size                                3 8388608
db_16k_cache_size                                      6 0
db_2k_cache_size                                       6 0
db_32k_cache_size                                      6 0
db_4k_cache_size                                       6 0
db_8k_cache_size                                       6 0
db_block_size                                          3 8192
db_cache_size                                          6 0
db_flash_cache_size                                    6 0
db_keep_cache_size                                     6 0
db_recovery_file_dest_size                             6 4781506560
db_recycle_cache_size                                  6 0
dnfs_batch_size                                        3 4096
global_context_pool_size                               2
hash_area_size                                         3 131072
inmemory_size                                          6 0
java_max_sessionspace_size                             3 0
java_pool_size                                         6 0
large_pool_size                                        6 0
max_dump_file_size                                     2 unlimited
max_string_size                                        2 STANDARD
memory_max_target                                      6 838860800
memory_target                                          6 838860800
object_cache_max_size_percent                          3 10
object_cache_optimal_size                              3 102400
olap_page_pool_size                                    6 0
parallel_execution_message_size                        3 16384
pga_aggregate_target                                   6 0
result_cache_max_size                                  6 2097152
sga_max_size                                           6 838860800
sga_target                                             6 0
shared_pool_reserved_size                              6 6291456
shared_pool_size                                       6 0
sort_area_retained_size                                3 0
sort_area_size                                         3 65536
streams_pool_size                                      6 0
unified_audit_sga_queue_size                           3 1048576
workarea_size_policy                                   2 AUTO

40 rows selected.
PDBs of my environment:
SQL> show pdbs
    CON_ID CON_NAME                       OPEN MODE  RESTRICTED
---------- ------------------------------ ---------- ----------
         2 PDB$SEED                       READ ONLY  NO
         3 PDB01                          READ WRITE NO
Queries that I used on every Scenario to check SGA sizes:
select * from v$sga order by 1;
select * from v$sgainfo order by 1;
select nvl(pool,name) pool, sum(bytes), con_id from v$sgastat group by nvl(pool,name), con_id order by 1,3,2;
select component, current_size, user_specified_size, con_id from v$memory_dynamic_components order by 1;
Let's begin...
Scenario 1:
For the first scenario I didn't change anything from the default configuration above. Let's check the results for the SGA queries and match them.
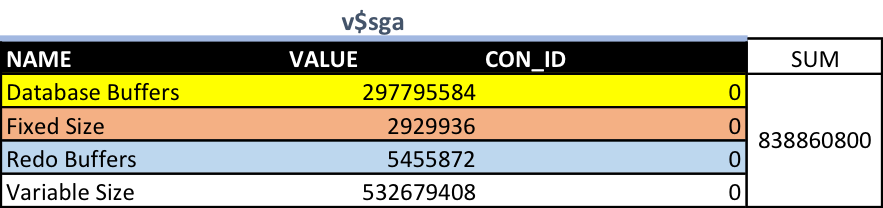
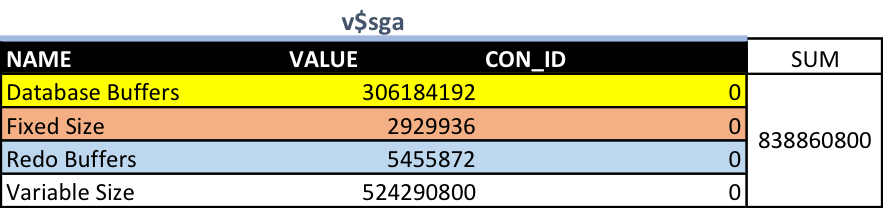
So, the SUM of bytes (VALUE column) in v$sga is the memory_target parameter (838860800), which is actually SGA + PGA. I've put colors for each line so will be easier to match them on next views:
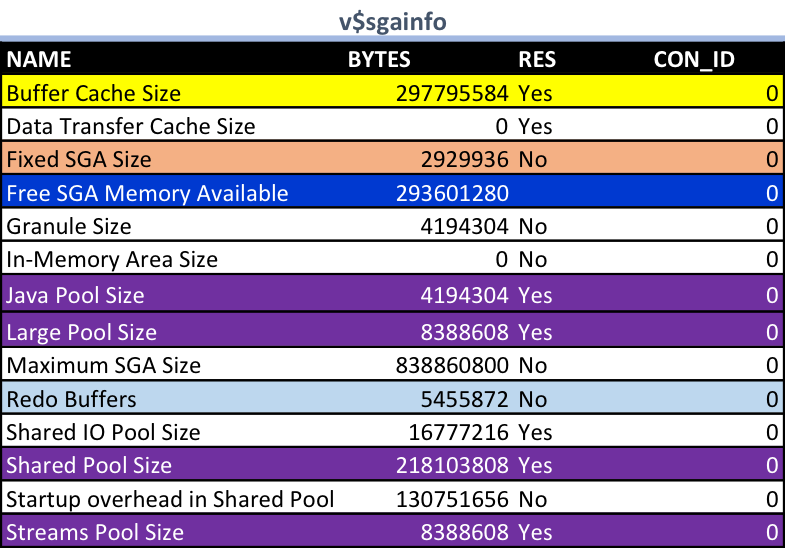
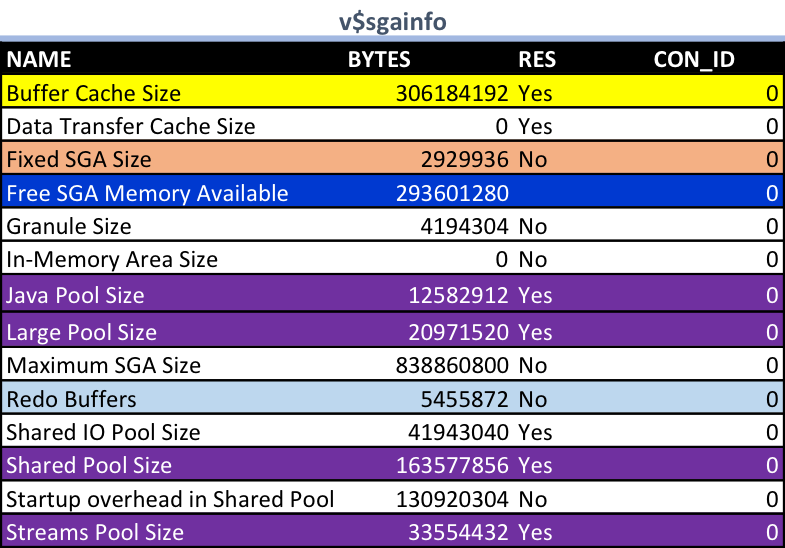
We can easily match the Buffer Cache (yellow), Fixed SGA Size (orange) and Redo Buffers (light blue) of v$sga and v$sgainfo.
However, the Variable Size from v$sga is still not easy to match. However, here we have Java/Large/Shared/Streams Pools that we can match with next views (purple).
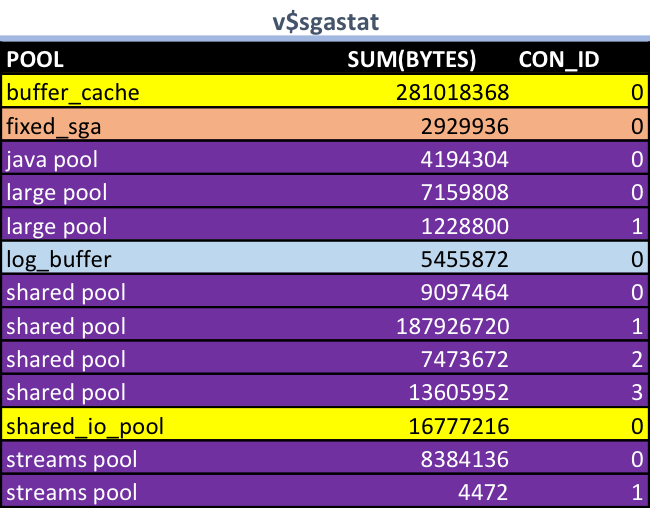
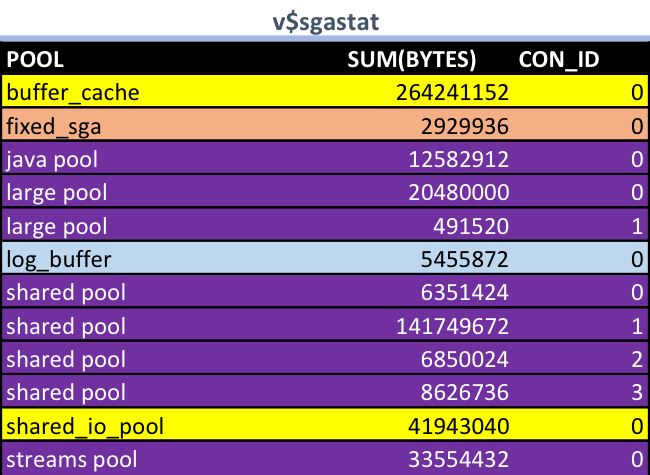
The first curious thing that we note when we compare v$sga or v$sgainfo with v$sgastat is that the Shared IO Pool is not part of the Shared Pool but part of the Buffer Cache (you need to SUM both to match with Buffer Cache line of v$sga/v$sgainfo)
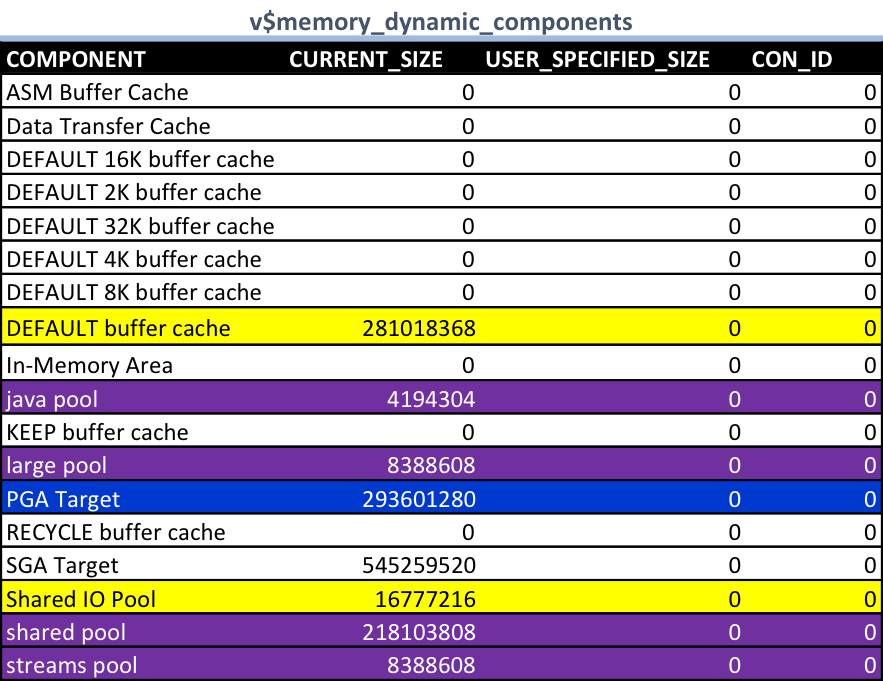
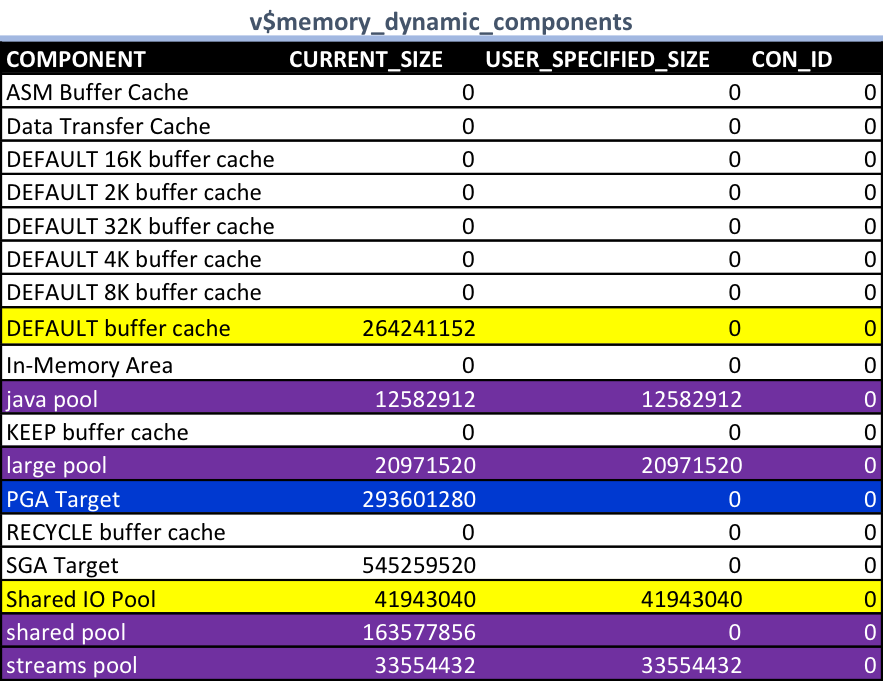
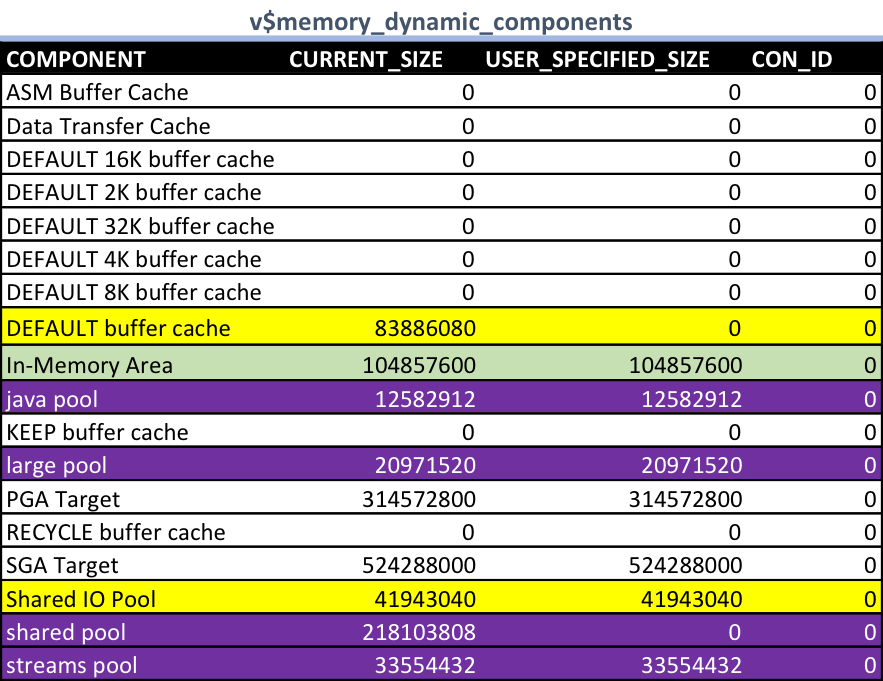
When we add the v$memory_dynamic_components into the game, it also confirms the previous conclusion: Shared IO Pool is part of Buffer Cache. Note also that the Free SGA Memory Available of v$sgainfo matches the PGA Target of this view, as we are in a AMM environment. In this view, we also don't have Fixed SGA and Log Buffer as we are talking only about dynamic components.
So how do we match Variable Size of v$sga with the lines from other 3 views? Note that Variable Size is almost the same as Purple (Pools) + Dark Blue (PGA).
Variable Size = 532679408
Purple + Blue = 4194304 + 8388608 + 218103808 + 8388608 + 293601280 = 532676608
The difference (532679408 - 532676608) is actually 2800 bytes only = 350 Kbytes
So in an AMM environment, the Variable Size of v$sga means the PGA + Java/Large/Shared/Streams Pool of either v$sgainfo, v$sgastat or v$memory_dynamic_components.
Conclusions until now:
- The v$sgainfo and v$memory_dynamic_components says that Shared IO Pool is actually part of the Buffer Cache inside the SGA.
- We have a difference of 350 KBytes between the Variable Size and the sum of components inside of it.
- In a AMM environment, SGA Variable Size includes the whole PGA, which makes sense.
Raw output:
SQL> select * from v$sga order by 1;

NAME                      VALUE     CON_ID
-------------------- ---------- ----------
Database Buffers      297795584          0
Fixed Size              2929936          0
Redo Buffers            5455872          0
Variable Size         532679408          0

SQL> select * from v$sgainfo order by 1;

NAME                                  BYTES RES     CON_ID
-------------------------------- ---------- --- ----------
Buffer Cache Size                 297795584 Yes          0
Data Transfer Cache Size                  0 Yes          0
Fixed SGA Size                      2929936 No           0
Free SGA Memory Available         293601280              0
Granule Size                        4194304 No           0
In-Memory Area Size                       0 No           0
Java Pool Size                      4194304 Yes          0
Large Pool Size                     8388608 Yes          0
Maximum SGA Size                  838860800 No           0
Redo Buffers                        5455872 No           0
Shared IO Pool Size                16777216 Yes          0
Shared Pool Size                  218103808 Yes          0
Startup overhead in Shared Pool   130751656 No           0
Streams Pool Size                   8388608 Yes          0

14 rows selected.

SQL> select component, current_size, user_specified_size, con_id from v$memory_dynamic_components order by 1;

COMPONENT                                                        CURRENT_SIZE USER_SPECIFIED_SIZE     CON_ID
---------------------------------------------------------------- ------------ ------------------- ----------
ASM Buffer Cache                                                            0                   0          0
DEFAULT 16K buffer cache                                                    0                   0          0
DEFAULT 2K buffer cache                                                     0                   0          0
DEFAULT 32K buffer cache                                                    0                   0          0
DEFAULT 4K buffer cache                                                     0                   0          0
DEFAULT 8K buffer cache                                                     0                   0          0
DEFAULT buffer cache                                                281018368                   0          0
Data Transfer Cache                                                         0                   0          0
In-Memory Area                                                              0                   0          0
KEEP buffer cache                                                           0                   0          0
PGA Target                                                          293601280                   0          0
RECYCLE buffer cache                                                        0                   0          0
SGA Target                                                          545259520                   0          0
Shared IO Pool                                                       16777216                   0          0
java pool                                                             4194304                   0          0
large pool                                                            8388608                   0          0
shared pool                                                         218103808                   0          0
streams pool                                                          8388608                   0          0

18 rows selected.

SQL> select nvl(pool,name) pool, sum(bytes), con_id from v$sgastat group by nvl(pool,name), con_id order by 1,3,2;

POOL                       SUM(BYTES)     CON_ID
-------------------------- ---------- ----------
buffer_cache                281018368          0
fixed_sga                     2929936          0
java pool                     4194304          0
large pool                    7159808          0
large pool                    1228800          1
log_buffer                    5455872          0
shared pool                   9097464          0
shared pool                 187926720          1
shared pool                   7473672          2
shared pool                  13605952          3
shared_io_pool               16777216          0
streams pool                  8384136          0
streams pool                     4472          1

13 rows selected.
Scenario 2:
For this scenario, I will play with Share IO Pool size to ensure that the 16Mbytes was not a coincidence. So, for parameters, everything is the same as before plus:
alter system set java_pool_size=10M scope=spfile;
alter system set large_pool_size=20M scope=spfile;
alter system set streams_pool_size=30M scope=spfile;
alter system set "_shared_io_pool_size"=40M scope=spfile;
Let's check the views:
Buffer Cache is now 8 Mbytes bigger than before (306184192-297795584). Everything is matching the same manner.
Java Pool is now with 10Mbytes, Large Pool with 20Mbytes, Streams Pool with 30Mbytes and Shared IO Pool with 40Mbytes, as expected.
Note that the buffer_cache + shared_io_pool from v$sgastat is still matching Buffer Cache Size from v$sga and v$sgainfo.
And the same applies for v$memory_dynamic_components. You need to add Shared IO Pool to DEFAULT buffer cache to have a match of Database Buffers of v$sga.
So, is the Variable Size of v$sga still matching Purple + Blue?
Variable Size = 524290800
Purple + Blue = 12582912 + 20971520 + 163577856 + 33554432 + 293601280 = 524288000
The difference (524290800 - 524288000) is still 2800 bytes = 350 Kbytes
Conclusions until now: same as before.
Raw output:
SQL> select * from v$sga order by 1;

NAME                      VALUE     CON_ID
-------------------- ---------- ----------
Database Buffers      306184192          0
Fixed Size              2929936          0
Redo Buffers            5455872          0
Variable Size         524290800          0

SQL> select * from v$sgainfo order by 1;

NAME                                  BYTES RES     CON_ID
-------------------------------- ---------- --- ----------
Buffer Cache Size                 306184192 Yes          0
Data Transfer Cache Size                  0 Yes          0
Fixed SGA Size                      2929936 No           0
Free SGA Memory Available         293601280              0
Granule Size                        4194304 No           0
In-Memory Area Size                       0 No           0
Java Pool Size                     12582912 Yes          0
Large Pool Size                    20971520 Yes          0
Maximum SGA Size                  838860800 No           0
Redo Buffers                        5455872 No           0
Shared IO Pool Size                41943040 Yes          0
Shared Pool Size                  163577856 Yes          0
Startup overhead in Shared Pool   130920304 No           0
Streams Pool Size                  33554432 Yes          0

14 rows selected.

SQL> select component, current_size, user_specified_size, con_id from v$memory_dynamic_components order by 1;

COMPONENT                                                        CURRENT_SIZE USER_SPECIFIED_SIZE     CON_ID
---------------------------------------------------------------- ------------ ------------------- ----------
ASM Buffer Cache                                                            0                   0          0
DEFAULT 16K buffer cache                                                    0                   0          0
DEFAULT 2K buffer cache                                                     0                   0          0
DEFAULT 32K buffer cache                                                    0                   0          0
DEFAULT 4K buffer cache                                                     0                   0          0
DEFAULT 8K buffer cache                                                     0                   0          0
DEFAULT buffer cache                                                264241152                   0          0
Data Transfer Cache                                                         0                   0          0
In-Memory Area                                                              0                   0          0
KEEP buffer cache                                                           0                   0          0
PGA Target                                                          293601280                   0          0
RECYCLE buffer cache                                                        0                   0          0
SGA Target                                                          545259520                   0          0
Shared IO Pool                                                       41943040            41943040          0
java pool                                                            12582912            12582912          0
large pool                                                           20971520            20971520          0
shared pool                                                         163577856                   0          0
streams pool                                                         33554432            33554432          0

18 rows selected.

SQL> select nvl(pool,name) pool, sum(bytes), con_id from v$sgastat group by nvl(pool,name), con_id order by 1,3,2;

POOL                       SUM(BYTES)     CON_ID
-------------------------- ---------- ----------
buffer_cache                264241152          0
fixed_sga                     2929936          0
java pool                    12582912          0
large pool                   20480000          0
large pool                     491520          1
log_buffer                    5455872          0
shared pool                   6351424          0
shared pool                 141749672          1
shared pool                   6850024          2
shared pool                   8626736          3
shared_io_pool               41943040          0
streams pool                 33554432          0

12 rows selected.
Scenario 3:
Now let's convert AMM to ASMM and enable In-Memory database option and see what happens. I will keep the environment the same as scenario 2 plus:
alter system reset memory_target scope=spfile;
alter system set sga_target=500M scope=spfile;
alter system set pga_aggregate_target=300M scope=spfile;
alter system set inmemory_size=100M scope=spfile;
Checking the v$ views:
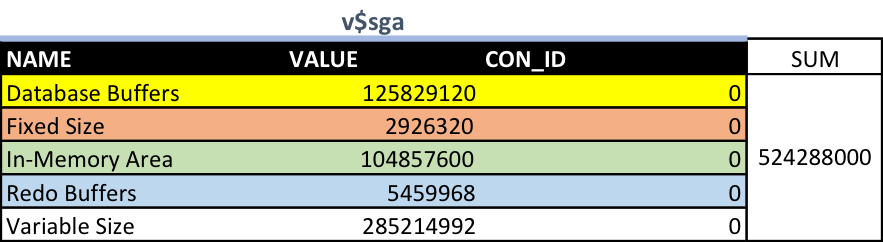
v$sga now shows a new In-Memory Area line. The SUM of all lines is not including PGA size anymore.
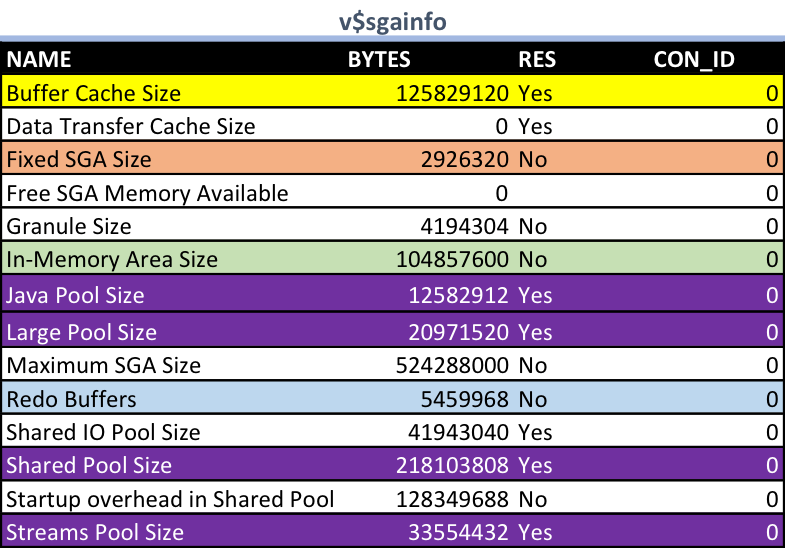
In v$sgainfo a the already exitent In-Memory Area line gets populated. Note that the Free SGA Memory Available is now zero as the DB cannot steal memory from PGA in a ASMM database.
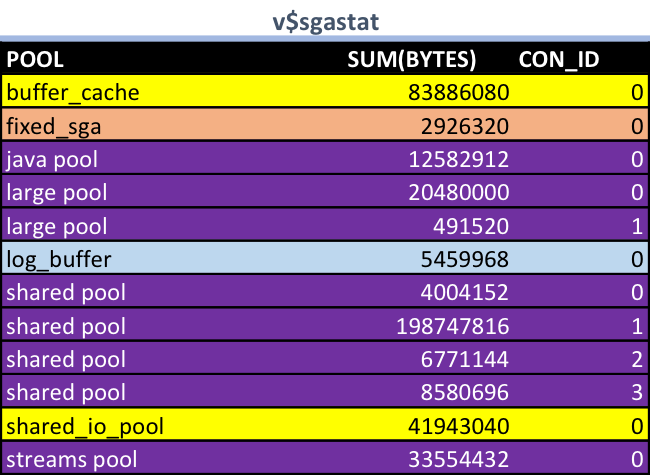
In v$sgastat we still have the same behavior of buffer_cache line that needs to be added with shared_io_pool line to result in the Buffer Cache Size of previous views.
And how do we match now the Variable Size of v$sga with the other views?
Variable Size = 285214992
Purple = 12582912 + 20971520 + 218103808 + 33554432 = 285212672
The difference (285214992 - 285212672) is now 2320 bytes = 290 Kbytes (5 Mbytes less than in AMM)
New conclusions:
- The new difference between the Variable Size and the actual pools dropped from 350 Kbytes to 290 Kbytes.
- In a ASMM env, SGA Variable Size does not include the PGA. This also makes sense.
Raw output:
SQL> select * from v$sga order by 1;

NAME                      VALUE     CON_ID
-------------------- ---------- ----------
Database Buffers      125829120          0
Fixed Size              2926320          0
In-Memory Area        104857600          0
Redo Buffers            5459968          0
Variable Size         285214992          0

SQL> select * from v$sgainfo order by 1;

NAME                                  BYTES RES     CON_ID
-------------------------------- ---------- --- ----------
Buffer Cache Size                 125829120 Yes          0
Data Transfer Cache Size                  0 Yes          0
Fixed SGA Size                      2926320 No           0
Free SGA Memory Available                 0              0
Granule Size                        4194304 No           0
In-Memory Area Size               104857600 No           0
Java Pool Size                     12582912 Yes          0
Large Pool Size                    20971520 Yes          0
Maximum SGA Size                  524288000 No           0
Redo Buffers                        5459968 No           0
Shared IO Pool Size                41943040 Yes          0
Shared Pool Size                  218103808 Yes          0
Startup overhead in Shared Pool   128349688 No           0
Streams Pool Size                  33554432 Yes          0

14 rows selected.

SQL> select component, current_size, user_specified_size, con_id from v$memory_dynamic_components order by 1;

COMPONENT                                                        CURRENT_SIZE USER_SPECIFIED_SIZE     CON_ID
---------------------------------------------------------------- ------------ ------------------- ----------
ASM Buffer Cache                                                            0                   0          0
DEFAULT 16K buffer cache                                                    0                   0          0
DEFAULT 2K buffer cache                                                     0                   0          0
DEFAULT 32K buffer cache                                                    0                   0          0
DEFAULT 4K buffer cache                                                     0                   0          0
DEFAULT 8K buffer cache                                                     0                   0          0
DEFAULT buffer cache                                                 83886080                   0          0
Data Transfer Cache                                                         0                   0          0
In-Memory Area                                                      104857600           104857600          0
KEEP buffer cache                                                           0                   0          0
PGA Target                                                          314572800           314572800          0
RECYCLE buffer cache                                                        0                   0          0
SGA Target                                                          524288000           524288000          0
Shared IO Pool                                                       41943040            41943040          0
java pool                                                            12582912            12582912          0
large pool                                                           20971520            20971520          0
shared pool                                                         218103808                   0          0
streams pool                                                         33554432            33554432          0

18 rows selected.

SQL> select nvl(pool,name) pool, sum(bytes), con_id from v$sgastat group by nvl(pool,name), con_id order by 1,3,2;

POOL                       SUM(BYTES)     CON_ID
-------------------------- ---------- ----------
buffer_cache                 83886080          0
fixed_sga                     2926320          0
java pool                    12582912          0
large pool                   20480000          0
large pool                     491520          1
log_buffer                    5459968          0
shared pool                   4004152          0
shared pool                 198747816          1
shared pool                   6771144          2
shared pool                   8580696          3
shared_io_pool               41943040          0
streams pool                 33554432          0

12 rows selected.
Scenario 4:
For this scenario, now I will enable some other Buffer Cache pools like 2k/4k/recycle/keep/etc. As before, the parameters are all the same of scenario 3 plus:
alter system set db_recycle_cache_size=10M scope=spfile;
alter system set db_keep_cache_size=10M scope=spfile;
alter system set db_2k_cache_size=10M scope=spfile;
alter system set db_4k_cache_size=10M scope=spfile;
alter system set db_16k_cache_size=10M scope=spfile;
alter system set db_32k_cache_size=10M scope=spfile;
alter system set sga_target=600M scope=spfile;
Let's check the views:

No surprise here. Let's check latter how we can match those lines with other views:
v$sga and v$sgainfo have a direct match as before (expect for Variable Size of v$sga).

And the same strange behavior regarding shared_io_pool again for v$sgastat.
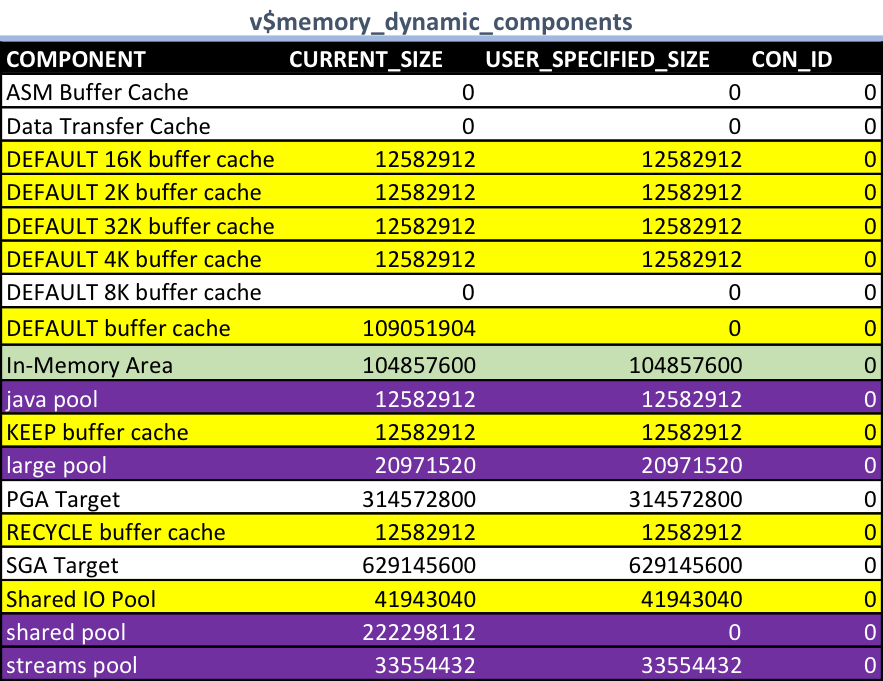
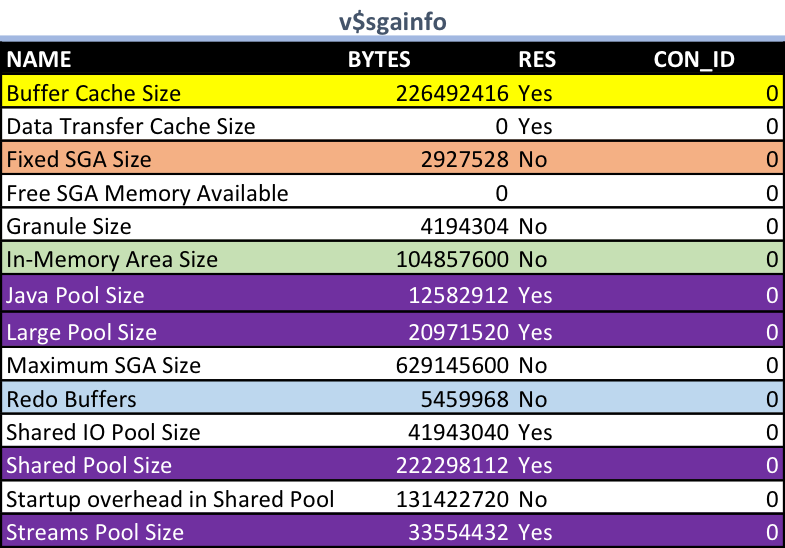
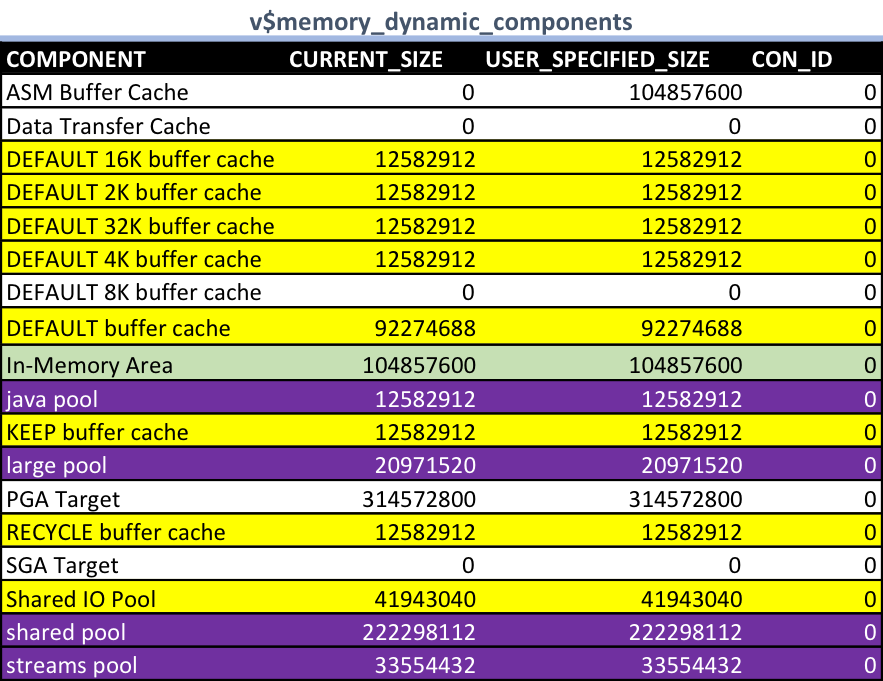
Now for v$memory_dynamic_components things get more excited. Note that the yellow lines that represents segments in Buffer Cache are nor more divided. We need to SUM all the "* buffer cache" and Shared IO Pool to have a match with Buffer Cache Size of v$sgainfo:
Buffer Cache in v$sgainfo = 226492416
"* buffer cache" and Shared IO Pool in v$memory_dynamic_components = 12582912 + 12582912 + 12582912 + 12582912 + 109051904 + 12582912 + 12582912 + 41943040 = 226492416
And what about v$sga Variable Size? It's almost again the SUM of purples for either v$sgastat, v$sgainfo or v$memory_dynamic_components:
Variable Size = 289408088
Purple = 12582912 + 20971520 + 222298112 + 33554432 = 289406976
The difference (289408088 - 289406976) dropped now to 1112 bytes = 139 Kbytes
New conclusions:
- The new difference between the Variable Size and the actual pools dropped from 290 Kbytes to 139 Kbytes.
Raw output:
SQL> select * from v$sga order by 1;

NAME                      VALUE     CON_ID
-------------------- ---------- ----------
Database Buffers      226492416          0
Fixed Size              2927528          0
In-Memory Area        104857600          0
Redo Buffers            5459968          0
Variable Size         289408088          0

SQL> select * from v$sgainfo order by 1;

NAME                                  BYTES RES     CON_ID
-------------------------------- ---------- --- ----------
Buffer Cache Size                 226492416 Yes          0
Data Transfer Cache Size                  0 Yes          0
Fixed SGA Size                      2927528 No           0
Free SGA Memory Available                 0              0
Granule Size                        4194304 No           0
In-Memory Area Size               104857600 No           0
Java Pool Size                     12582912 Yes          0
Large Pool Size                    20971520 Yes          0
Maximum SGA Size                  629145600 No           0
Redo Buffers                        5459968 No           0
Shared IO Pool Size                41943040 Yes          0
Shared Pool Size                  222298112 Yes          0
Startup overhead in Shared Pool   131422720 No           0
Streams Pool Size                  33554432 Yes          0

14 rows selected.

SQL> select component, current_size, user_specified_size, con_id from v$memory_dynamic_components order by 1;

COMPONENT                                                        CURRENT_SIZE USER_SPECIFIED_SIZE     CON_ID
---------------------------------------------------------------- ------------ ------------------- ----------
ASM Buffer Cache                                                            0                   0          0
DEFAULT 16K buffer cache                                             12582912            12582912          0
DEFAULT 2K buffer cache                                              12582912            12582912          0
DEFAULT 32K buffer cache                                             12582912            12582912          0
DEFAULT 4K buffer cache                                              12582912            12582912          0
DEFAULT 8K buffer cache                                                     0                   0          0
DEFAULT buffer cache                                                109051904                   0          0
Data Transfer Cache                                                         0                   0          0
In-Memory Area                                                      104857600           104857600          0
KEEP buffer cache                                                    12582912            12582912          0
PGA Target                                                          314572800           314572800          0
RECYCLE buffer cache                                                 12582912            12582912          0
SGA Target                                                          629145600           629145600          0
Shared IO Pool                                                       41943040            41943040          0
java pool                                                            12582912            12582912          0
large pool                                                           20971520            20971520          0
shared pool                                                         222298112                   0          0
streams pool                                                         33554432            33554432          0

18 rows selected.

SQL> select nvl(pool,name) pool, sum(bytes), con_id from v$sgastat group by nvl(pool,name), con_id order by 1,3,2;

POOL                       SUM(BYTES)     CON_ID
-------------------------- ---------- ----------
buffer_cache                184549376          0
fixed_sga                     2927528          0
java pool                    12582912          0
large pool                   20480000          0
large pool                     491520          1
log_buffer                    5459968          0
shared pool                   5184240          0
shared pool                 201543320          1
shared pool                   6800384          2
shared pool                   8770168          3
shared_io_pool               41943040          0
streams pool                 33554432          0

12 rows selected.
Scenario 5:
For the last scenario, I will now define each SGA component size individually and check what happens. Again, the same parameters as before plus:
alter system reset sga_target scope=spfile;
alter system set db_cache_size=100M scope=spfile;
alter system set shared_pool_size=200M scope=spfile;
Checking the views:
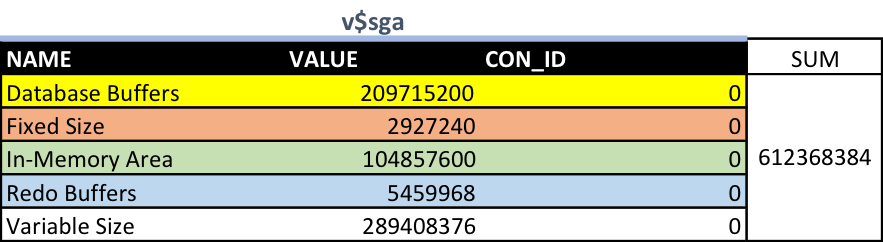
Nothing special changed in v$sga.

Nothing special changed in v$sgainfo.
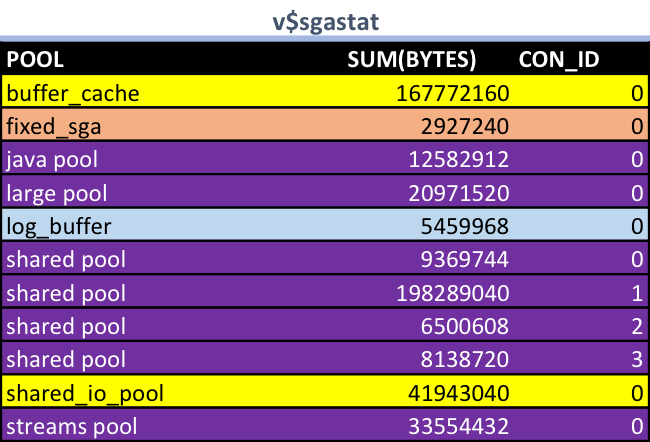
Nothing special changed in v$sgastat.
Lastly, let's check if the difference among Variable Size of v$sga and SGA pools have changed.
Variable Size = 289408376
Purple = 12582912 + 20971520 + 222298112 + 33554432 = 289406976
The difference (289408376 - 289406976) increased now to 1400 bytes = 175 Kbytes
New conclusions:
- The new difference between the Variable Size and the actual pools increased from 139 Kbytes to 170 Kbytes.
Raw output:
SQL> select * from v$sga order by 1;

NAME                      VALUE     CON_ID
-------------------- ---------- ----------
Database Buffers      209715200          0
Fixed Size              2927240          0
In-Memory Area        104857600          0
Redo Buffers            5459968          0
Variable Size         289408376          0

SQL> select * from v$sgainfo order by 1;

NAME                                  BYTES RES     CON_ID
-------------------------------- ---------- --- ----------
Buffer Cache Size                 209715200 Yes          0
Data Transfer Cache Size                  0 Yes          0
Fixed SGA Size                      2927240 No           0
Free SGA Memory Available                 0              0
Granule Size                        4194304 No           0
In-Memory Area Size               104857600 No           0
Java Pool Size                     12582912 Yes          0
Large Pool Size                    20971520 Yes          0
Maximum SGA Size                  612368384 No           0
Redo Buffers                        5459968 No           0
Shared IO Pool Size                41943040 Yes          0
Shared Pool Size                  222298112 Yes          0
Startup overhead in Shared Pool   127957928 No           0
Streams Pool Size                  33554432 Yes          0

14 rows selected.

SQL> select component, current_size, user_specified_size, con_id from v$memory_dynamic_components order by 1;

COMPONENT                                                        CURRENT_SIZE USER_SPECIFIED_SIZE     CON_ID
---------------------------------------------------------------- ------------ ------------------- ----------
ASM Buffer Cache                                                            0           104857600          0
DEFAULT 16K buffer cache                                             12582912            12582912          0
DEFAULT 2K buffer cache                                              12582912            12582912          0
DEFAULT 32K buffer cache                                             12582912            12582912          0
DEFAULT 4K buffer cache                                              12582912            12582912          0
DEFAULT 8K buffer cache                                                     0                   0          0
DEFAULT buffer cache                                                 92274688            92274688          0
Data Transfer Cache                                                         0                   0          0
In-Memory Area                                                      104857600           104857600          0
KEEP buffer cache                                                    12582912            12582912          0
PGA Target                                                          314572800           314572800          0
RECYCLE buffer cache                                                 12582912            12582912          0
SGA Target                                                                  0                   0          0
Shared IO Pool                                                       41943040            41943040          0
java pool                                                            12582912            12582912          0
large pool                                                           20971520            20971520          0
shared pool                                                         222298112           222298112          0
streams pool                                                         33554432            33554432          0

18 rows selected.

SQL> select nvl(pool,name) pool, sum(bytes), con_id from v$sgastat group by nvl(pool,name), con_id order by 1,3,2;

POOL                       SUM(BYTES)     CON_ID
-------------------------- ---------- ----------
buffer_cache                167772160          0
fixed_sga                     2927240          0
java pool                    12582912          0
large pool                   20971520          0
log_buffer                    5459968          0
shared pool                   9369744          0
shared pool                 198289040          1
shared pool                   6500608          2
shared pool                   8138720          3
shared_io_pool               41943040          0
streams pool                 33554432          0

11 rows selected.
Conclusion:
After these 5 tests, I came with 3 major conclusions:
- The Shared IO Pool is part of Buffer Cache accordingly to v$sgastat and v$memory_dynamic_components views. v$sga put it also in Database Buffers, not in Variable Size. v$sgainfo show them separated.
- The Variable Size of v$sga is the sum of Large Pool, Java Pool, Streams Pool and Shared Pool (not Shared IO Pool). If AMM is enabled, it also includes PGA.
- There is very small difference (350 Kbytes is the highest I got) in Variable Size to match it with the pools. I would love to understand why this difference is not exactly zero. If anyone knows please share.


8 comments
Skip to comment form
Hi Rodrigo,
thanks to your post, I've made the script to show detailed info from all of these 4 views: https://github.com/xtender/xt_scripts/blob/master/sgainfo.sql
Author
Awesome! Thanks for sharing!
Excellent work! You will go far
Nice work, it explained why the max usage of SGA according to Oracle was larger as the parameter sga_max 🙂
Just what I was looking for, many thanks for your efforts
Hi,
Firstly a big thanks to Rodrigo for taking the time to share this and to Sayan for making the scripts available!
Rodrigo, one quick question:
From scenario 1 "However, the Variable Size from v$sga is still not easy to match. However, here we have Java/Large/Shared/Streams Pools that we can match with next views (purple)."
Should we expect the sum of these four elements (4194304 + 8388608 + 218103808 + 8388608) = 239075328 to equal Variable Size from v$SGA (532679408) ?
Or am I missing something?
Thanks in advance for any feedback you have time to give.
Regards,
Jes
Author
Hi Jes,
As I mentioned in the "Conclusions" section, the Variable Size of v$sga is the sum of Large Pool, Java Pool, Streams Pool and Shared Pool only if Automatic Memory Management is NOT enabled. If AMM is enabled, it also includes PGA!
Cheers,
RJ
Hi Rodrigo,
Thanks for putting this excellent effort.
I just want to ask something that migh be related to this article. I find that Shared Pool Size is different between v$sgastat and v$memory_dynamic_components.
The query
"SELECT pool, sum(bytes)/1024/1024/1024 AS "Size (GB)" FROM v$sgastat WHERE pool = 'shared pool' GROUP BY pool;"
gives me 2.7 GB
..while this query :
"SELECT component, current_size/1024/1024/1024, max_size, granule_size, last_oper_type FROM v$memory_dynamic_components;"
gives me 5.6 GB.
So whats the difference ?
thanks for your answer.
keep up the excellent work . Cheers mate